Monitoring errors in a web application is critical for delivering a reliable user experience. Modern tools like New Relic make it possible to track, categorize, and alert on virtually all types of errors. This article dives deep into frontend error monitoring, with practical guidance for React/Next.js apps.
Understanding Error Types in Web Applications
Before setting up monitoring, you need to know the types of errors you can encounter:
1.1 JavaScript Errors
- Runtime exceptions caused by code logic.
- Examples:
const x = undefined;
console.log(x.foo); // JS Error: Cannot read property 'foo'
1.2 Syntax Errors
- Errors that occur when the JS parser cannot interpret the code.
- Example:
eval("alert('oops"); // SyntaxError: Unexpected end of input
1.3 Promise Rejections
- Errors in asynchronous operations not handled via
.catch(). - Example:
Promise.reject("API failed");
1.4 Network Errors
- Failed API requests, 404 or 500 responses.
- These can be monitored using Fetch/XHR instrumentation.
1.5 Page & User Event Errors
- Route navigation failures in SPAs.
- UI event failures like button click errors or form submission issues.
💡 Pro Tip: Categorizing errors from the start helps filter high-priority issues in dashboards.
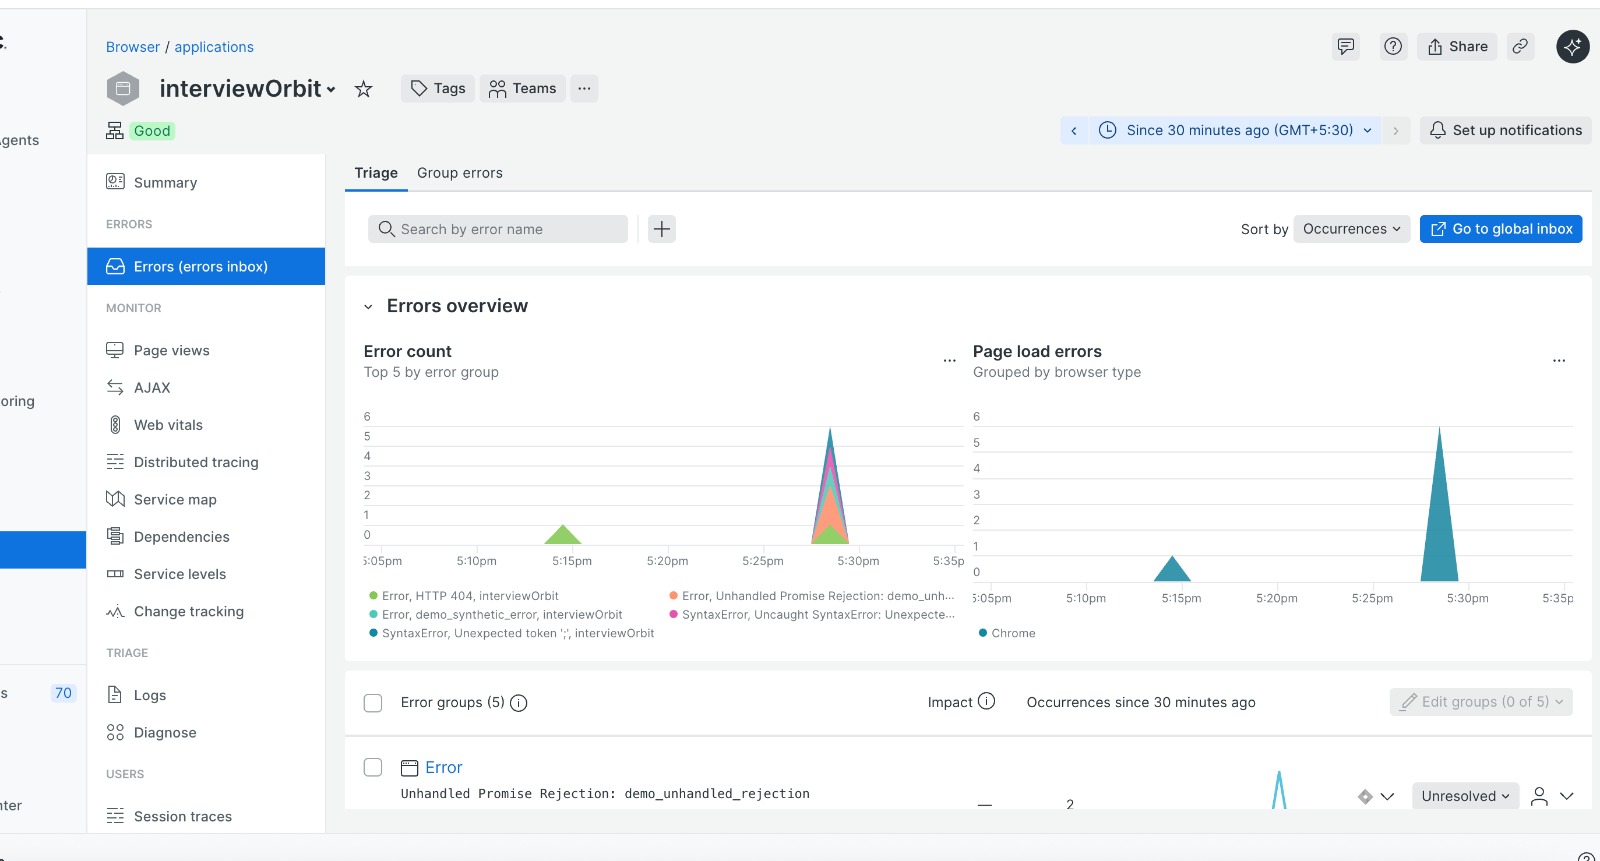
2. How New Relic Helps Track Errors
New Relic Browser agent automatically collects:
- JavaScript errors
- Promise rejections
- Page load times
- XHR/Fetch failures
- SPA route changes
Custom features you can enable:
2.1 Custom Error Logging
You can send custom errors to the dashboard:
if (window.newrelic) {
newrelic.noticeError(new Error("Custom functional error"), {
category: "Network Error",
endpoint: "/api/user"
});
}
- Category helps group errors.
- Attributes can carry extra info like user ID, page route, or environment.
2.2 Page Actions / Event Tracking
Track critical user actions to link errors to user behavior:
newrelic.addPageAction("formSubmit", {
form: "contactForm",
userId: 123
});
- Useful for monitoring form submissions, checkout flows, or button clicks.
- Can be filtered in New Relic Dashboard for deeper insights.
2.3 Performance Metrics
New Relic provides real-user monitoring (RUM):
- Page load times
- SPA route transitions
- Slow network requests
- Metrics can be correlated with errors to identify performance-induced failures.
3. Categorizing Errors Like a Pro
Proper categorization allows quick diagnosis:
| TypeHow to TrackNotes | ||
| JS Error | Automatic by agent | Uncaught exceptions |
| Syntax Error | Automatic | Parser issues |
| Promise Rejection | Automatic | Async failures |
| Network Error | XHR/Fetch tracking | Monitor API failures |
| Custom Event Errors | noticeError | Tag with category & attributes |
💡 Pro Tip: Include environment info (dev,staging,prod) in attributes for better filtering.
4. Alerts and Notifications
- Alerts are configured in the New Relic dashboard.
- Examples of alert rules:
- Trigger if more than 5 errors occur in 1 minute.
- Trigger on slowest page load > 5s.
- Trigger on API failure rate > 10%.
- Alerts can go to email, Slack, PagerDuty, or webhook.
⚡ Pro Tip: Combine error type + page action for targeted alerts. For example, alert only if “checkout button” errors exceed threshold.
5. Testing Errors Locally
Simulate errors in your app before deploying:
// JS error
throw new Error("Test JS error");
// Promise rejection
Promise.reject("Test Promise rejection");
// Custom error
newrelic.noticeError(new Error("Test functional error"), { category: "Test" });
- Errors appear in dashboard immediately if agent is configured.
- Test different environments (
local,staging,prod) to validate configuration.
6. Advanced Topics for Pro-Level Monitoring
6.1 Session & User Context
- Attach errors to specific user sessions.
- Include user ID, browser, device, and OS for debugging.
6.2 SPA (Single Page Application) Routing
- Monitor route changes in React/Next.js to catch navigation failures:
import { useEffect } from 'react';
import { useRouter } from 'next/router';
export default function RouteTracker() {
const router = useRouter();
useEffect(() => {
const handleRouteError = (url) => {
newrelic.noticeError(new Error("Route failed"), { route: url });
};
router.events.on('routeChangeError', handleRouteError);
return () => router.events.off('routeChangeError', handleRouteError);
}, [router.events]);
return null;
}
6.3 Performance + Error Correlation
- Analyze slow pages causing JS errors.
- Combine performance metrics with error tracking to prioritize fixes.
6.4 Logging Custom Data
- Track extra info like:
- API request payload
- User actions leading to error
- Time of day / environment
7. Combining New Relic with Backend Logging
- Frontend errors → sent to New Relic (real-time dashboard)
- Backend errors → stored in logs or database (Node.js + Winston or Pino)
- Correlate frontend + backend for full-stack observability.
8. Pro-Level Recommendations
- Always include environment tags:
dev,staging,prod. - Use custom attributes for better filtering.
- Monitor network failures separately (API + external services).
- Test locally before pushing to production.
- Set intelligent alerts: only alert when thresholds are exceeded.
- Review dashboards weekly to catch silent issues.
- Consider integrations: Slack, email, PagerDuty, Jira.
9. Conclusion
New Relic is a powerful library, but maximizing its potential requires careful setup:
- Track all error types
- Categorize and tag errors
- Monitor page performance
- Set actionable alerts
- Correlate errors with user sessions
By combining these strategies, you can proactively catch issues before they impact users and maintain high reliability in production apps.
